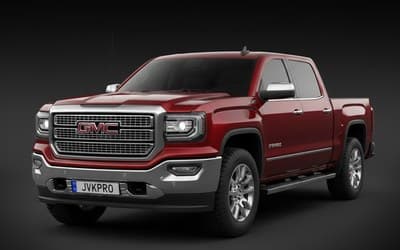
GMC Sierra Stage 1
21 engines – 195–445 hp
21
engines
+57 hp
Max gain
+8%
Avg. gain
✓
Eco Tuning
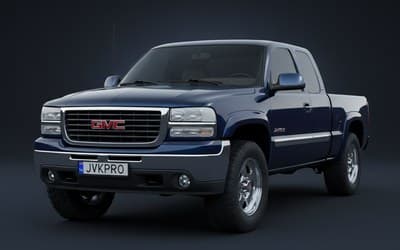
1999 - 2007
6 engines
| Engine | Fuel | Stock (hp) | Stage 1 (hp) | Gain |
|---|---|---|---|---|
| 6.6 Duramax 365hp | Diesel | 365 | 398 | +33 (9%) |
| 8,1 V8 330hp | Petrol | 330 | 352 | +22 (7%) |
| 4.3 V6 200hp | Petrol | 200 | 221 | +21 (11%) |
| 4.8 V8 295hp | Petrol | 295 | 316 | +21 (7%) |
| 5.3 V8 295hp | Petrol | 295 | 316 | +21 (7%) |
| 6.0 V8 360hp | Petrol | 360 | 381 | +21 (6%) |
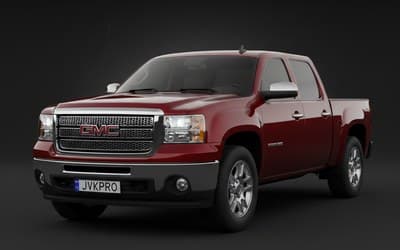
2008 - 2013
6 engines
| Engine | Fuel | Stock (hp) | Stage 1 (hp) | Gain |
|---|---|---|---|---|
| 6.6 Duramax 365hp | Diesel | 365 | 397 | +32 (9%) |
| 6.2 V8 403hp | Petrol | 403 | 428 | +25 (6%) |
| 4.3 V6 195hp | Petrol | 195 | 218 | +23 (12%) |
| 5.3 V8 326hp | Petrol | 326 | 348 | +22 (7%) |
| 4.8 V8 302hp | Petrol | 302 | 323 | +21 (7%) |
| 6.0 V8 360hp | Petrol | 360 | 381 | +21 (6%) |
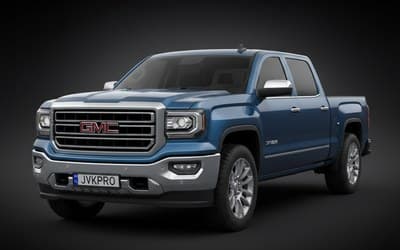
2014 - 2016
4 engines
| Engine | Fuel | Stock (hp) | Stage 1 (hp) | Gain |
|---|---|---|---|---|
| 6.6 Duramax 365hp | Diesel | 365 | 396 | +31 (8%) |
| 6.2 V8 420hp | Petrol | 420 | 443 | +23 (5%) |
| 4.3 V6 285hp | Petrol | 285 | 306 | +21 (7%) |
| 5.3 V8 355hp | Petrol | 355 | 376 | +21 (6%) |
2017 ->
5 engines
| Engine | Fuel | Stock (hp) | Stage 1 (hp) | Gain |
|---|---|---|---|---|
| 6.6 V8 445hp | Diesel | 445 | 502 | +57 (13%) |
| 6.0 V8 360hp | Petrol | 360 | 384 | +24 (7%) |
| 6.2 V8 420hp | Petrol | 420 | 443 | +23 (5%) |
| 4.3 V6 285hp | Petrol | 285 | 307 | +22 (8%) |
| 5.3 V8 355hp | Petrol | 355 | 377 | +22 (6%) |
FAQ
Is Stage 1 safe for the engine?+
Yes, Stage 1 is a mild optimization within factory safety margins. We use dealer-level equipment and verify results on a dyno.
How long does it take?+
Usually 2–4 hours, including diagnostics, remapping, and a control measurement on our dynamometer.
Does it affect fuel consumption?+
Stage 1 can reduce consumption (better torque curve) or slightly increase it under aggressive driving. On average, consumption stays the same.